FLUflux
FLUflux is a visualization of the correlations between international flight travel data and the outbreaks of global diseases during the last decade: SARS, Avian Flu, and influenza A (H1N1). The assumption was that events such as these worldwide pandemics can have an effect on the influx of people travelling between countries, specially if those countries are the affected by the disease. In a more general way, international flight travel could indicate the ocurrence of specific historical events (related to health, politics, economics, etc) by sudden (or more progressive) changes in the total numbers of passanger traveling between countries. This visualization tries to show the magnitude of those effects. It was produced during the Visualizar ’09 workshop at the Medialab-Prado Madrid, “Datos Públicos, Datos en Público”
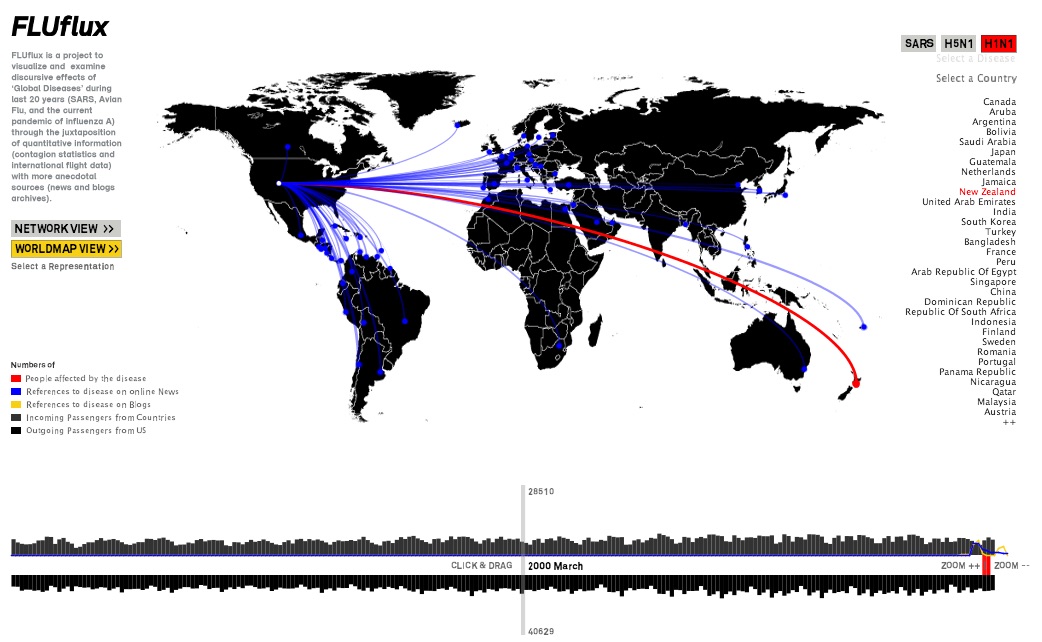
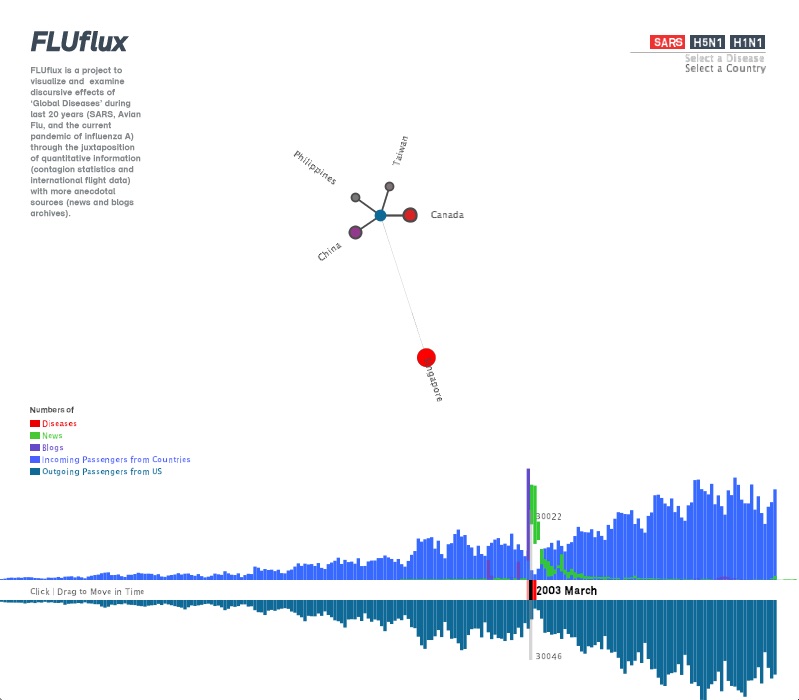
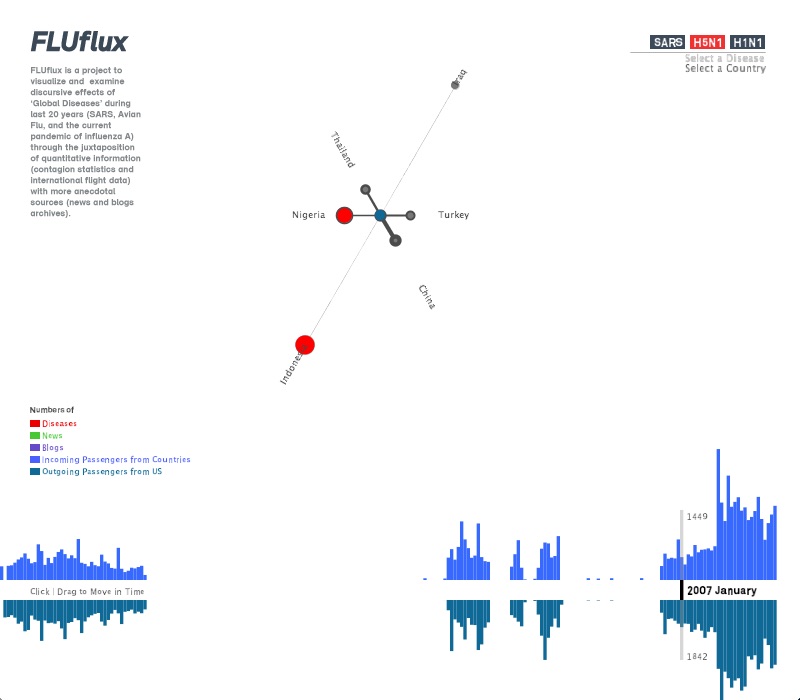
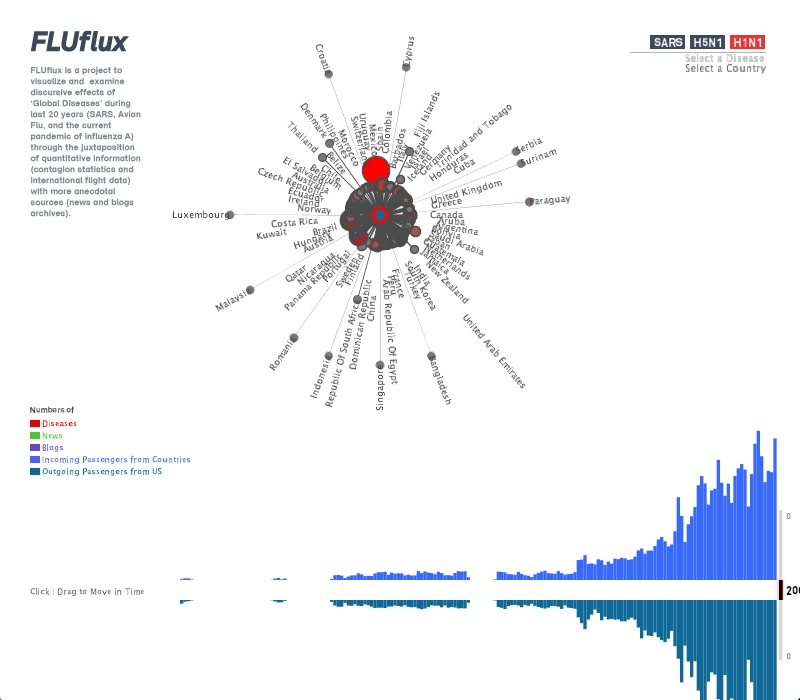
Series of images from the FLUflux visualization.
For more information about the project and the data behind it, check these blog posts: FLUflux data visualization project at Medialab-Prado and Updated FLUflux. The source code is available here.