Molecular Visualization
As I worked on the computational problem of folding proteins from their amino-acid sequence, I became interested in the 3D visualization of such molecules, and ended up writing my own protein structure visualizer. This gave me the oportunity to learn about the OpenGL programming interface to create interactive 3D graphics. My visualizer, called YAPView (Yet Another Protein Viewer), was able to render protein molecules in a variety of representaions, from all-atom to ribbon diagrams:
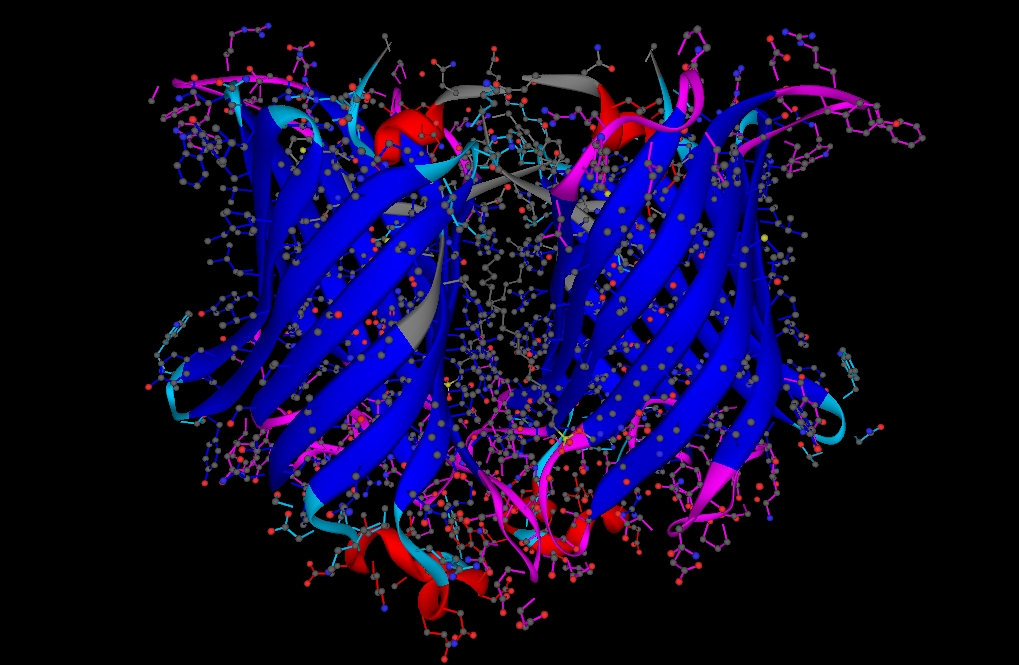
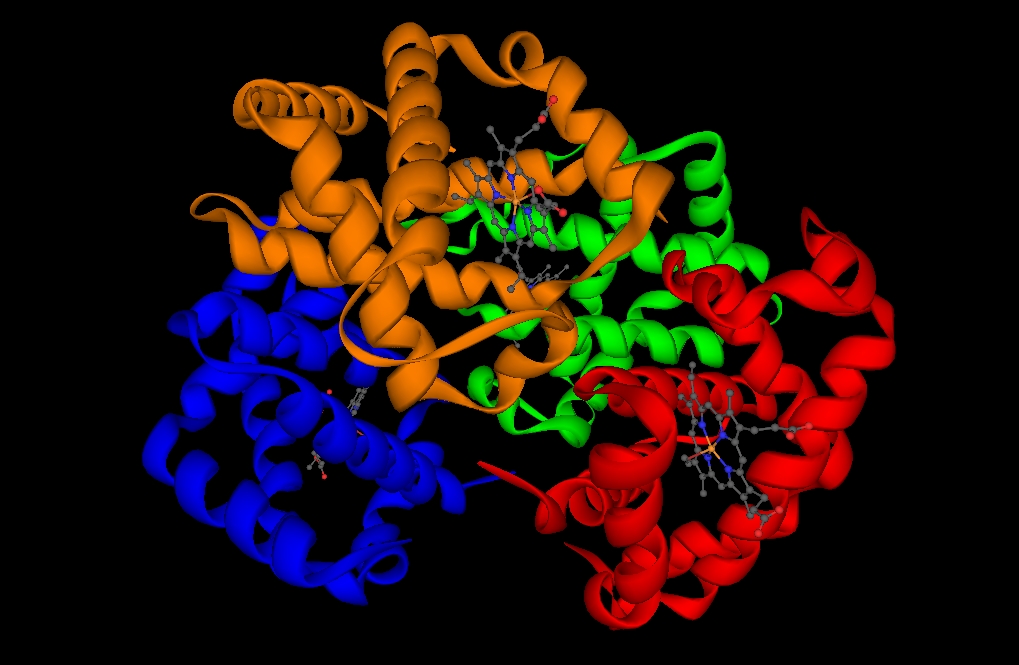

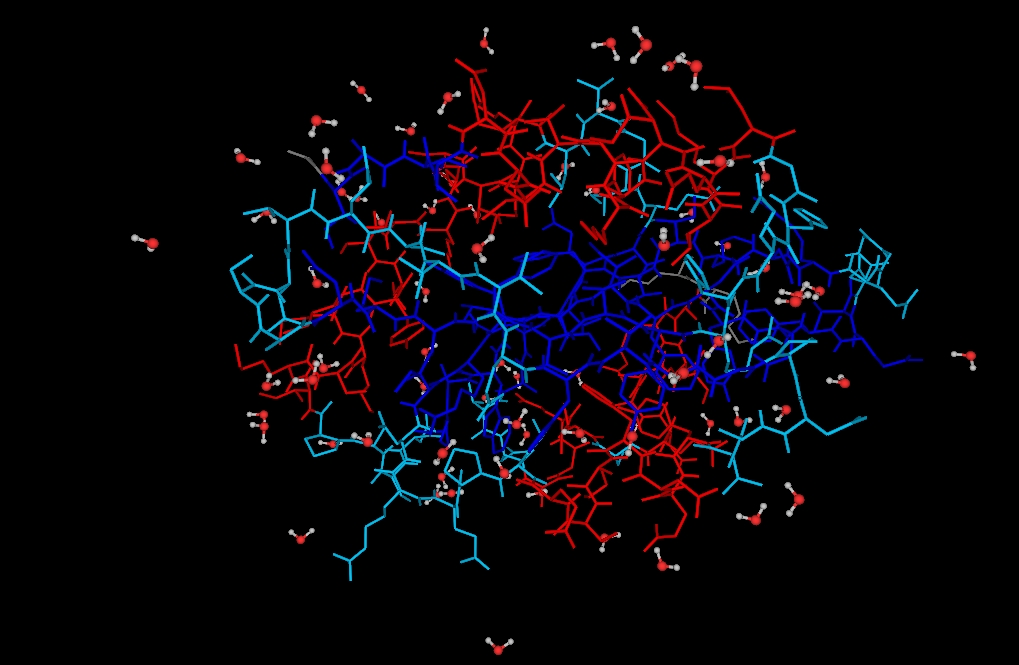
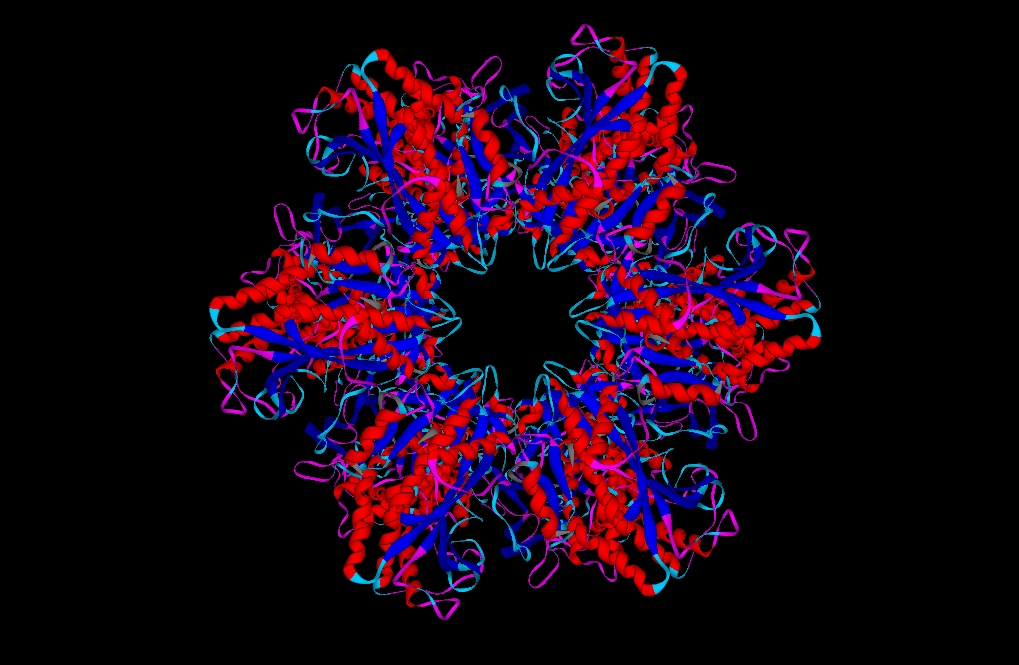
Some protein renderings generated with YAPView.
YAPView’s Windows installer and source code (written in Delphi!) are still available on Sourceforge, even though I’m no longer maintaining it. As the name of the tool suggests, there are many other biomolecular visualization tools. The idea of using ribbons to represent these complex molecules goes back to the Jane Richardson at Duke University, which originally used this technique to crate beautiful hand-drawn renderings of proteins such as the one below:

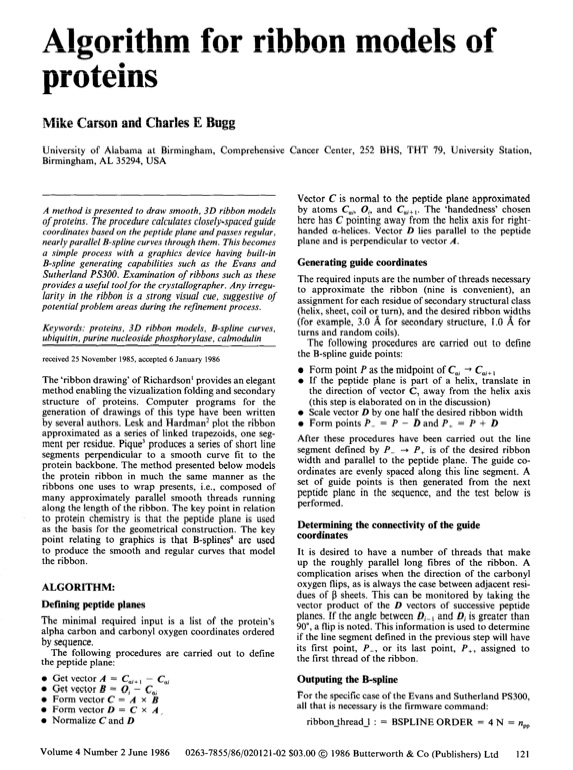
Later on, algrithms to generate these ribbon structures automatically with a computer were proposed by Mike Carson and Charles Bugg in the mid-80s:
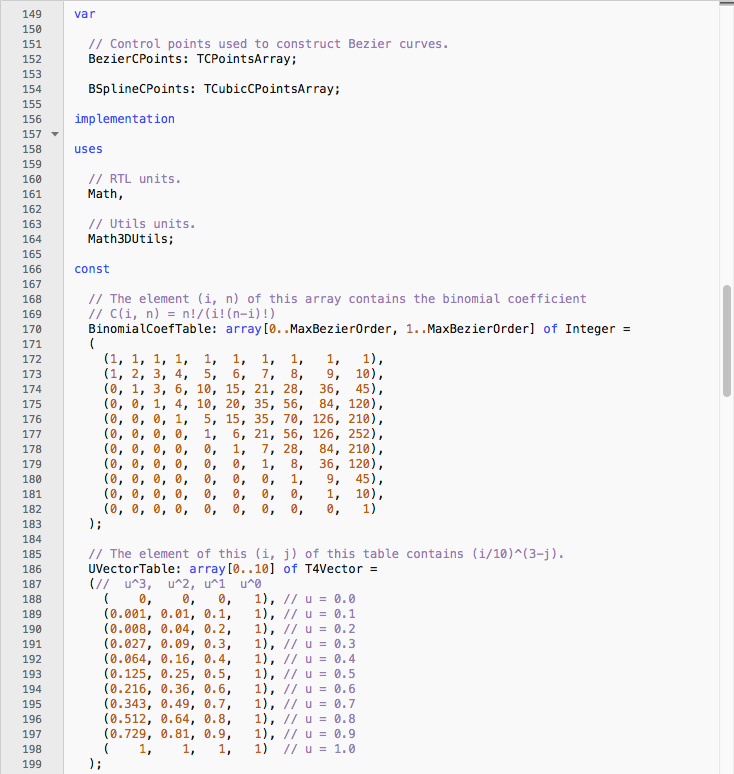
Below you can see a screenshot of my implementation of Carson and Bugg’s algorithm, in Delphi Pascal:
This code eventually became handy in projects that had nothing to do with protein visualization, like Latent State and Trazos Club ;-)